Validating Network
Different from other chapters, the code in this chapters are run in the order they are given, meaning each task code blocks are not independent.
Load Network and Attributes
We’ll use the same network from the Dams count example.
network load_file("data/ohio-river/ohio.network")
network count()
network outlet()

node.is_usgs = NAME match "^[0-9]+";
node.is_dam = !is_usgs;
network count(nodes.is_usgs)
network count(nodes.is_dam)
Results:
5987
"03399800"
1806
4181
Then we load the node attributes from the gis files, we can see some of the variables are loaded from NID website.
network gis_load_attrs("data/ohio-river/nid-uniq.gpkg", "nidId")
network gis_load_attrs("data/ohio-river/GageLoc.shp.zip", "SOURCE_FEA")
network gis_load_attrs("data/ohio-river/gages-II.gpkg", "STAID")
network gis_load_attrs("data/ohio-river/usgs-drainage.csv", "SiteNumber")

node[03399800].SiteNumber # only USGS gages have it
node(INDEX < 5).yearCompleted # only NID dams have it
node(INDEX < 5).GEOM # all nodes have it although from different sources
Results:
{
  03399800 = <None>
}
{
  03399800 = <None>,
  IL50499 = 1980,
  IL00070 = 1960,
  IL00955 = 1977,
  IL40055 = 1980
}
{
  03399800 = "POINT (-88.4234349499133 37.1612042742605 0)",
  IL50499 = "POINT (-88.42921894 37.16622664)",
  IL00070 = "POINT (-88.57139 37.21975)",
  IL00955 = "POINT (-88.78582 37.38365)",
  IL40055 = "POINT (-88.77145 37.401709)"
}
Also note that, while loading GIS files it also loads the geometry into “GEOM” attribute (you can change it through change function argument).
Process Attributes
Since we need a quick and easy way to identify USGS gage and NID dam, we use regex to categorize them.
node.is_usgs = NAME match "^[0-9]+";
node.is_dam = !is_usgs;
network count(nodes.is_usgs)
network count(nodes.is_dam)
Results:
1806
4181
The basin area is stored as different variable in each dataset, we want to combine them into a single one.
node.ba = first_attr(["drainageArea", "DRAIN_SQKM", "Drainage"])
network count(nodes.ba?) / count()
Results:
0.7561382996492401
Even then we only have 75% of the nodes with basin area. Since the DrainageArea is in sqmiles
If we look at some examples here on two sources of basin area of USGS gages, we can see the problems:
node(is_usgs & Drainage? & DRAIN_SQKM? & INDEX < 100) array(Drainage, DRAIN_SQKM)
Results:
{
  03384450 = ["42.9", 111.1266],
  03383000 = ["255.0", 660.5415],
  03382100 = ["147.0", 367.272]
}
- The
Drainagevalue areString, - The units are different (confirmed from metadata of datasets).
So we reconcile that,
node(Drainage?).basin_area = float(Drainage);
node(DRAIN_SQKM?).basin_area = DRAIN_SQKM * 0.38610216;
*Error*:
Error in function float: cannot parse float from empty string
We got an error, seems like Drainage contains empty strings as well. That and the String part comes from loading a CSV without data types (.csvt file).
Let’s fix the code for that, and also let’s get the basin_area for dams.
node(Drainage? & Drainage match "[0-9]+(.[0-9]+)?").basin_area = float(Drainage);
node(DRAIN_SQKM?).basin_area = DRAIN_SQKM * 0.38610216;
node(drainageArea?).basin_area = float(drainageArea);

node(INDEX < 10).basin_area
network count(nodes.basin_area?) / count()
Results:
{
  03399800 = <None>,
  IL50499 = 144000,
  IL00070 = <None>,
  IL00955 = <None>,
  IL40055 = 0.08,
  IL00039 = <None>,
  03386500 = 9.853134072120001,
  IL00102 = 2,
  03386000 = <None>,
  03385500 = <None>
}
0.755971271087356
Check for Incorrect Basin Areas
Now we have all the different variables combined into a single one with same data type and unit. Let’s do a quick analysis to see if there are points in the network where nodes have larger area than input nodes.
node.incorrect = basin_area < sum(inputs.basin_area);
network count(nodes.incorrect)
*Error*:
Attribute not found
The error here comes from the fact that not all nodes contain basin_area attribute. Since basin_area? will only check for the current node, we use a default value when the values are not available into a temporary variable.
node.temp_ba = basin_area ? 0.0;
node.incorrect = basin_area? & (basin_area < sum(inputs.temp_ba));
network count(nodes.incorrect)
network count(nodes.incorrect) / count()
Results:
547
0.09136462335059295
That’s around 10% error rate.
Looking at the actual values, few of them seem to be due to minor errors in values, while most of them seem to be from large input area.
node(incorrect & INDEX < 400) array(basin_area, sum(inputs.temp_ba))
Results:
{
  IL00028 = [1.5, 30.036998660096],
  IL50443 = [0.04, 141009.11000000002],
  KY00192 = [0.07, 0.31],
  IN04021 = [0.08, 0.2],
  IN03653 = [0.04, 0.37],
  IL50585 = [0.03, 0.16],
  IL01085 = [240, 240.171142047264],
  IL00606 = [0.6, 57],
  IN00316 = [0.09, 0.15],
  IN00317 = [0.15, 0.7000000000000001],
  IN00319 = [0.7000000000000001, 43.053904369656],
  IN03161 = [0.06, 0.07],
  IN03160 = [0.07, 3.0100000000000002],
  IN04048 = [0.4, 0.53],
  IN00627 = [0.53, 1.1300000000000001],
  IN03433 = [0.03, 1.82],
  IN00617 = [0.27, 0.49],
  IN00480 = [0.56, 21.637975860936002],
  IN00618 = [0.41000000000000003, 1.2700000000000002],
  IN00098 = [0.33, 263.021357392616],
  IN00035 = [0.23, 168.12355234608],
  03343010 = [13732, 13755.171304576803],
  IN00528 = [0.21, 0.32],
  IN00151 = [1.18, 4.75],
  IN03337 = [1.1500000000000001, 42.9097178978],
  IN00107 = [0.55, 8.22],
  IN00209 = [1.8, 8.48],
  IN00091 = [0.6900000000000001, 0.87],
  IN00092 = [0.87, 8.38]
}
This could be due to the error in snapping to the streamlines. It is also possible that some basin area that are missing are contributing to the unaccounted area.
Let’s try to fix them, or avoid points without data.
node.all_inputs_ba = all(inputs.basin_area?);
node.incorrect = basin_area? & all_inputs_ba & (
	basin_area < (0.975 * sum(inputs.basin_area))
);
network count(nodes.incorrect)
network count(nodes.incorrect) / count()
Results:
451
0.07532988140972106
Looks like 7.5% of the errors are reasonable errors from network detection.
network count(nodes.incorrect & nodes.is_usgs)
network count(nodes.incorrect & nodes.is_dam)
Results:
8
443
This shows that the majority of the errors come from the NID dams, which makes sense given the GageLoc.shp data has points indexed to the NHDPlus streamlines, while the NID Dams are not indexed to it. Furthermore, looking at the attributes in QGIS shows, many dams are in locations without streamlines, and even then sometimes they have unusually large basin area values for their location.
Export to GIS for visualization
We can export this result to a GIS file and look into individual cases in QGIS.
network gis_save_nodes(
    "output/ohio-gages-check.gpkg",
	"GEOM",
	{
		NAME="String",
		is_usgs="String",
		incorrect="String",
		basin_area="Float"
	}
)
Results:
We also need connection information to cross reference, let’s make them through some string manipulation. NADI GIS plugin uses WKT format for geometries, which are string values, so we can manipulate them using string functions.
Note: we should probably add a function for this in future. A WKT plugin to work with geometries.
node.xy_coords = str_find_all(node.GEOM, "-?[0-9]+[.][0-9]+");
node(output._?).out_coords = str_find_all(output.GEOM, "-?[0-9]+[.][0-9]+");
node(! output._?).conn_geom = GEOM
node(output._?).conn_geom = env.render(
	"LINESTRING ({_x1} {_y1}, {_x2} {_y2})",
	x1=get(node.xy_coords, 0),
	y1=get(node.xy_coords, 1),
	x2=get(node.out_coords, 0),
	y2=get(node.out_coords, 1)
)
node(output._? & (INDEX < 10)).conn_geom

network gis_save_connections("output/ohio-conn-all.gpkg", "conn_geom")
Results:
{
  IL50499 = "LINESTRING (-88.42921894 37.16622664, -88.4234349499133 37.1612042742605)",
  IL00070 = "LINESTRING (-88.57139 37.21975, -88.42921894 37.16622664)",
  IL00955 = "LINESTRING (-88.78582 37.38365, -88.42921894 37.16622664)",
  IL40055 = "LINESTRING (-88.77145 37.401709, -88.42921894 37.16622664)",
  IL00039 = "LINESTRING (-88.68815 37.38965, -88.42921894 37.16622664)",
  03386500 = "LINESTRING (-88.6736645 37.4156072, -88.68815 37.38965)",
  IL00102 = "LINESTRING (-88.66408 37.41518, -88.6736645 37.4156072)",
  03386000 = "LINESTRING (-88.6637356477429 37.4140878122472, -88.66408 37.41518)",
  03385500 = "LINESTRING (-88.6494395725886 37.4141446558289, -88.6637356477429 37.4140878122472)"
}
When we visualize the output in QGIS, we can see the nodes where the basin_area are not correct based on the network information.
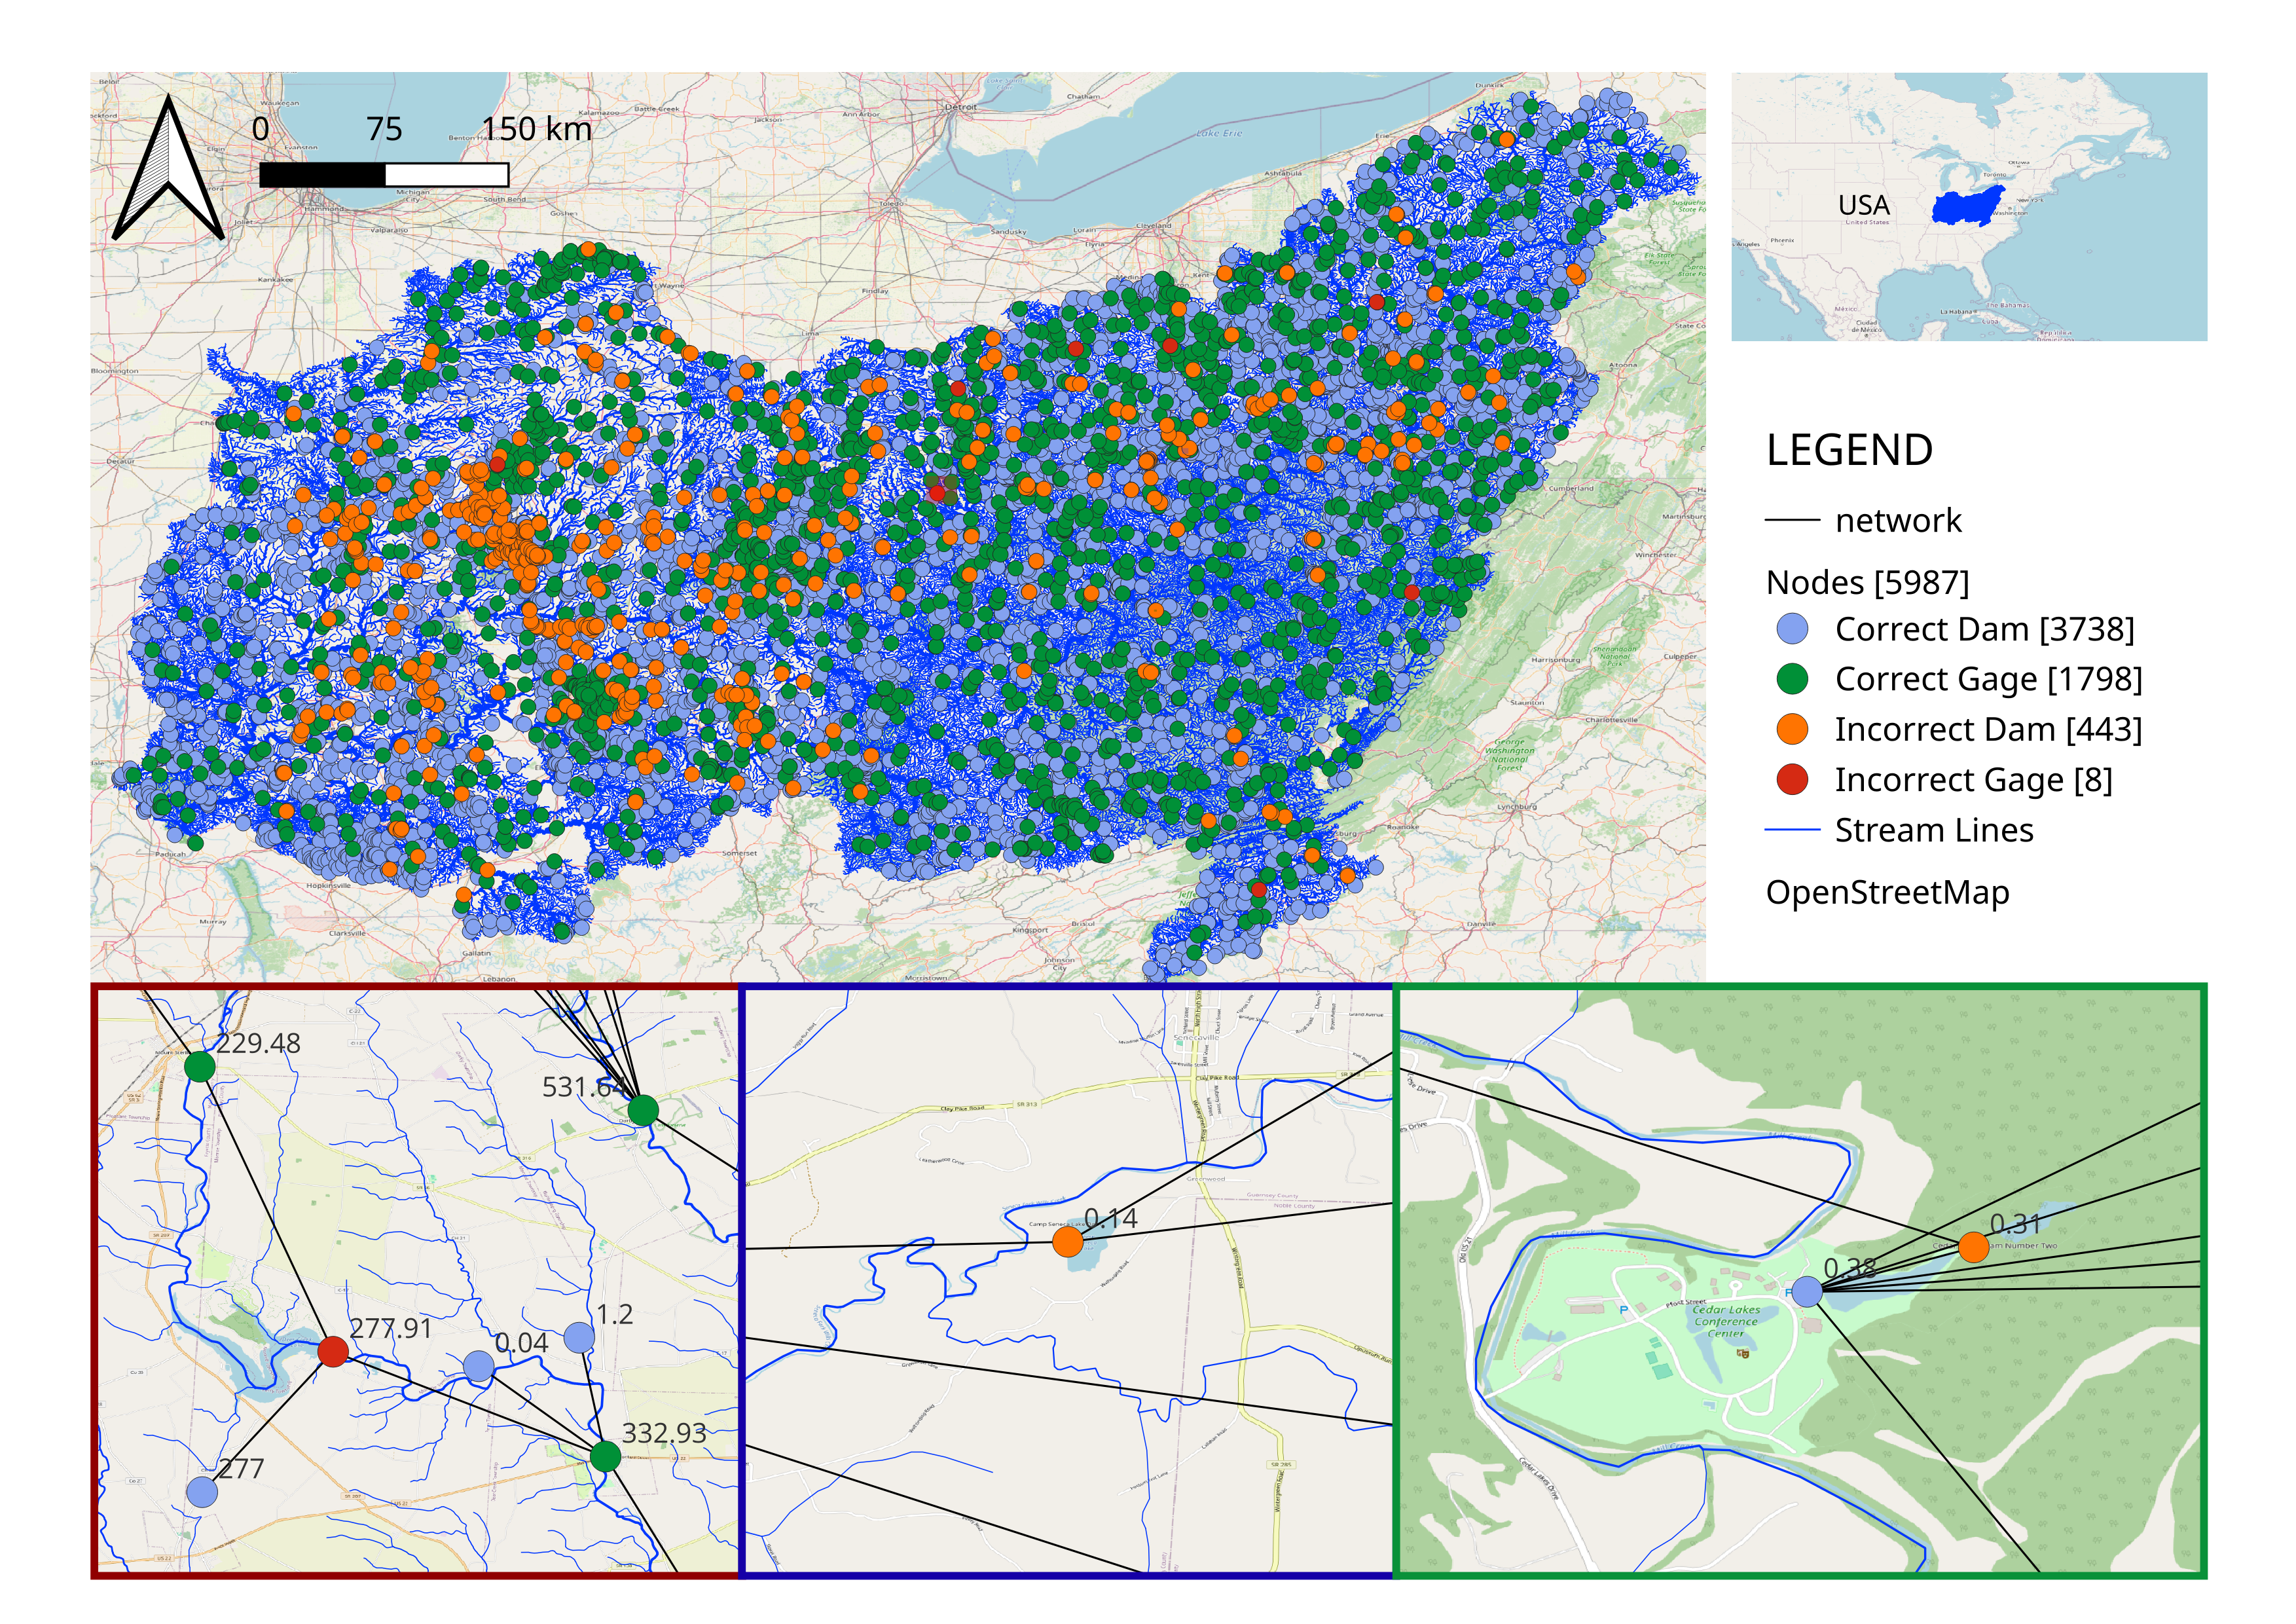
The zoomed in images at the bottom shows some of the reasons:
- [left] Incorrect Data in database (I think the dam coordinates are wrong on the blue dot with 277 basin area),
- [middle & right] Not enough streamlines for smaller details, and
- Nearest river detection algorithm problem from not considering river width.
The example for the last problem can be seen in the Video demostration for NADI QGIS Plugin.